US Producer Price Inflation Latest: 6.3% Year-over-Year
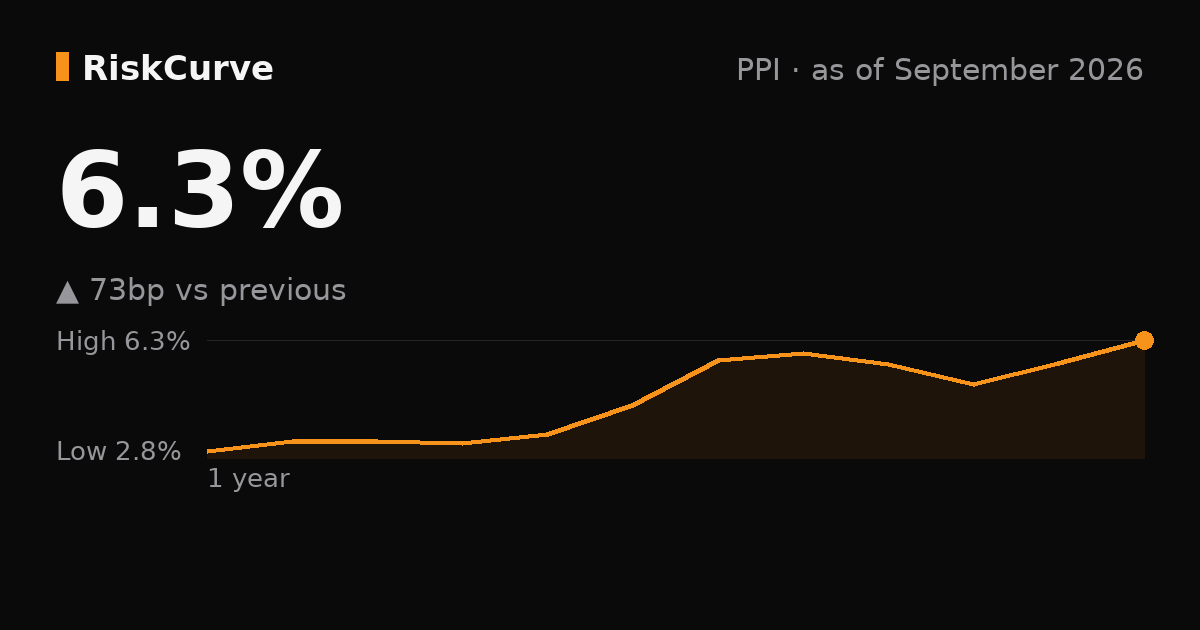
The producer price index measures the prices domestic producers receive for what they sell, rather than what consumers pay. The headline figure is final demand: goods, services and construction sold to their final users. It is up 6.3% year-over-year as of September 2026, +0.7pp versus the previous reading.
Producer prices matter because they sit upstream of consumer prices. When wholesale and input costs rise, some of that pressure is passed on to shoppers within a few months, so PPI often moves before CPI does. The pass-through is far from one-for-one — margin compression, contracts and hedges absorb part of any move — but the direction is informative.
Two details shape how the series reads. BLS publishes the 12-month change from the unadjusted index, which is the basis used here; the seasonally adjusted index drives the month-over-month figure. And because food and energy swing on weather and geopolitics, the core measure strips out food, energy and trade services — trade services being retailer and wholesaler margins, which move for their own reasons.
We track final demand, its core measure and the contributions breakdown on the RiskCurve dashboard.
It is 0.7pp higher than a month ago (Aug 2026), and 3.3pp higher than a year ago (Sep 2025).
It is above the 3.7% average of the period we track, which has run from 2.8% (Oct 2025) to 6.3% (Sep 2026) — the highest in that window (since Oct 2024).
PPI Final Demand (year-over-year) — recent values
| Date | Value |
|---|---|
| Sep 2026 | 6.3% |
| Aug 2026 | 5.6% |
| Jul 2026 | 4.9% |
| Jun 2026 | 5.6% |
| May 2026 | 5.9% |
| Apr 2026 | 5.7% |
| Mar 2026 | 4.3% |
| Feb 2026 | 3.4% |
| Jan 2026 | 3.1% |
| Dec 2025 | 3.1% |
Values as published by the source. Macro series are revised after first release; this table shows the most recent vintage. Saved dataset: JSON.