Fed Funds Rate: 3.88% as of Nov 16
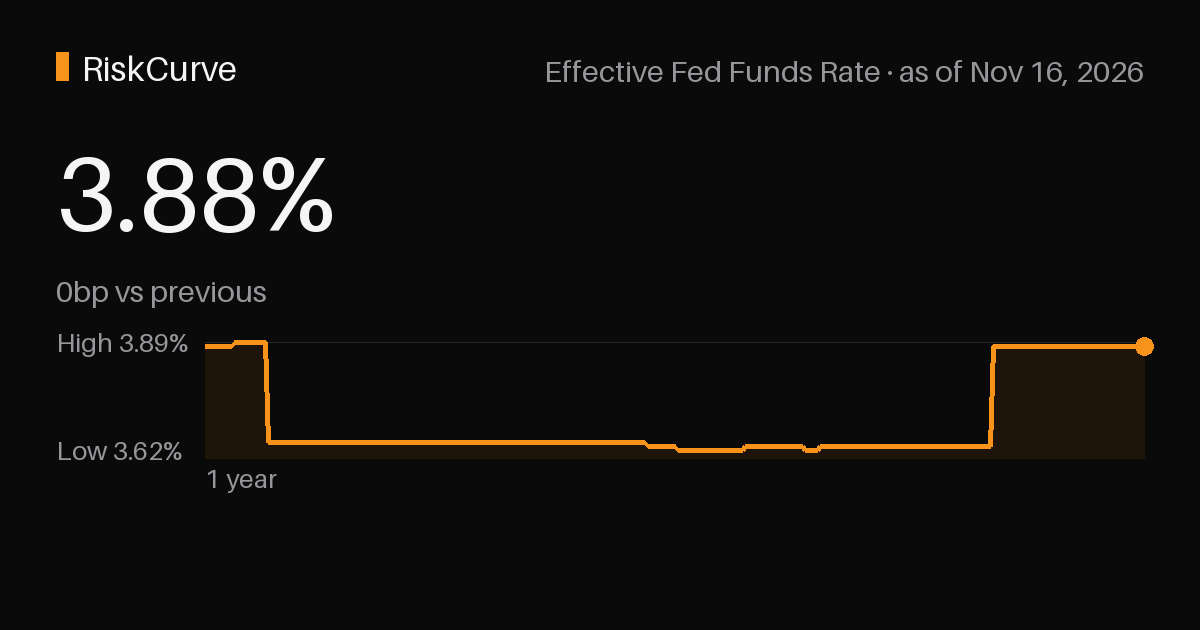
The federal funds rate is the interest rate at which depository institutions lend reserves to one another overnight. The effective rate — the volume-weighted median of those transactions — is currently 3.88% as of November 16, 2026, unchanged versus the prior reading.
It is the single most powerful price in the financial system. The Federal Open Market Committee sets a target range for it at each meeting, and every other rate in the economy — prime loans, mortgages, credit cards, corporate borrowing — is priced as a spread off that anchor. When the Fed moves, it moves the global cost of money.
The committee raises rates to cool demand and bring inflation down, and cuts them to support employment when growth falters. The market does not wait for the decision, though: the 2-year Treasury yield and the market-implied path from Treasury yields price the expected path months in advance, so by the time a cut or hike arrives it is usually already discounted.
For investors, the level of the policy rate sets the risk-free hurdle, shapes the curve, and drives the relative appeal of cash versus duration versus equities. We track the effective rate alongside the market-implied path from Treasury yields on the Rate Outlook tab of the RiskCurve dashboard.
It is unchanged over the period to a month ago (Oct 16, 2026), and unchanged over the period to a year ago (Nov 14, 2025).
It is above the 3.69% average of the period we track, which has run from 3.62% (May 19, 2026) to 3.89% (Nov 28, 2025).
Effective Fed Funds Rate — recent values
| Date | Value |
|---|---|
| Nov 16, 2026 | 3.88% |
| Nov 13, 2026 | 3.88% |
| Nov 12, 2026 | 3.88% |
| Nov 10, 2026 | 3.88% |
| Nov 09, 2026 | 3.88% |
| Nov 06, 2026 | 3.88% |
| Nov 05, 2026 | 3.88% |
| Nov 04, 2026 | 3.88% |
| Nov 03, 2026 | 3.88% |
| Nov 02, 2026 | 3.88% |
Values as published by the source. Macro series are revised after first release; this table shows the most recent vintage. Saved dataset: JSON.