US PCE Inflation Latest: 3.4% Year-over-Year
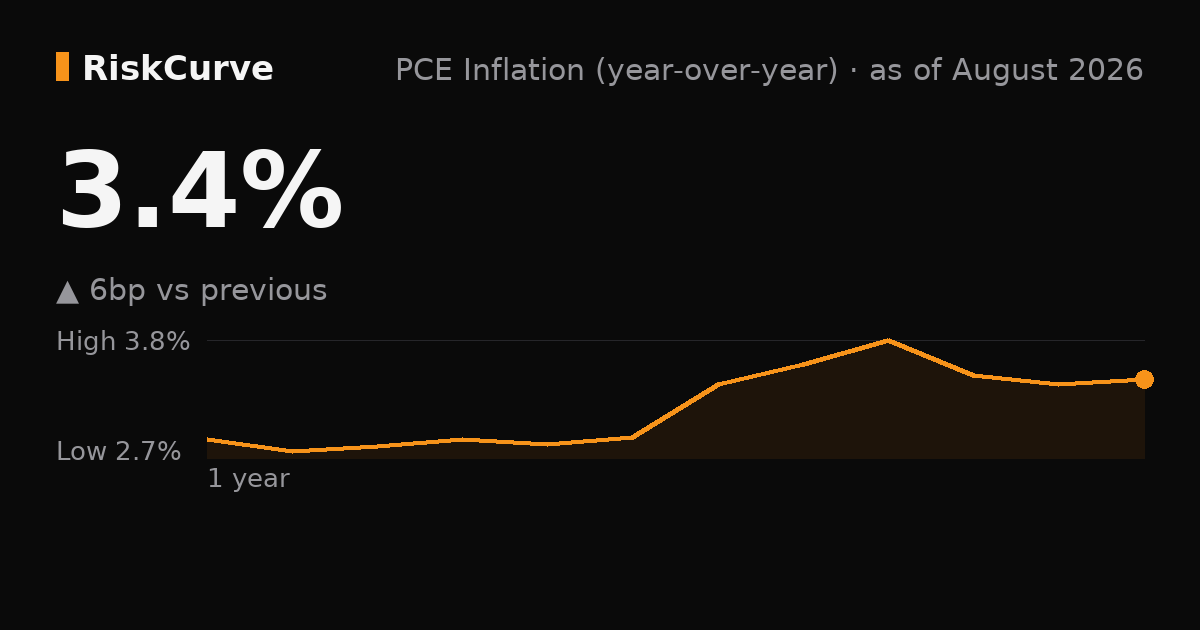
The PCE price index measures the prices of everything American households consume, whether they pay for it directly or not. PCE inflation is running at 3.4% year-over-year as of August 2026, +0.1pp versus the previous reading.
It is the Federal Reserve’s preferred inflation gauge: since 2012 the FOMC has defined its 2% goal in terms of the PCE price index rather than CPI. Two design choices explain the preference. PCE covers the whole consumption basket — including things households rarely pay for out of pocket, such as employer-provided health insurance and Medicare services — and its weights adjust as households substitute away from whatever has become expensive, which CPI’s fixed basket does not.
The upshot is that PCE inflation usually runs a few tenths below CPI. That gap is structural, not a sign that one measure is wrong, and it is why a CPI print near 3% can sit alongside a PCE print nearer 2.5%. Core PCE strips out food and energy and is the number to watch for the underlying trend.
BEA publishes the PCE price index seasonally adjusted only, so the month and the 12-month change on this page both come from the same series. We track PCE and core PCE alongside CPI on the RiskCurve dashboard.
It is 0.1pp higher than a month ago (Jul 2026), and 0.7pp higher than a year ago (Aug 2025).
It is above the 2.8% average of the period we track, which has run from 2.7% (Oct 2025) to 3.8% (May 2026) — the highest since Jun 01, 2026.
PCE Inflation (year-over-year) — recent values
| Date | Value |
|---|---|
| Aug 2026 | 3.4% |
| Jul 2026 | 3.4% |
| Jun 2026 | 3.5% |
| May 2026 | 3.8% |
| Apr 2026 | 3.6% |
| Mar 2026 | 3.4% |
| Feb 2026 | 2.8% |
| Jan 2026 | 2.7% |
| Dec 2025 | 2.8% |
| Nov 2025 | 2.7% |
Values as published by the source. Macro series are revised after first release; this table shows the most recent vintage. Saved dataset: JSON.