10-Year Breakeven Inflation Today: 2.33%
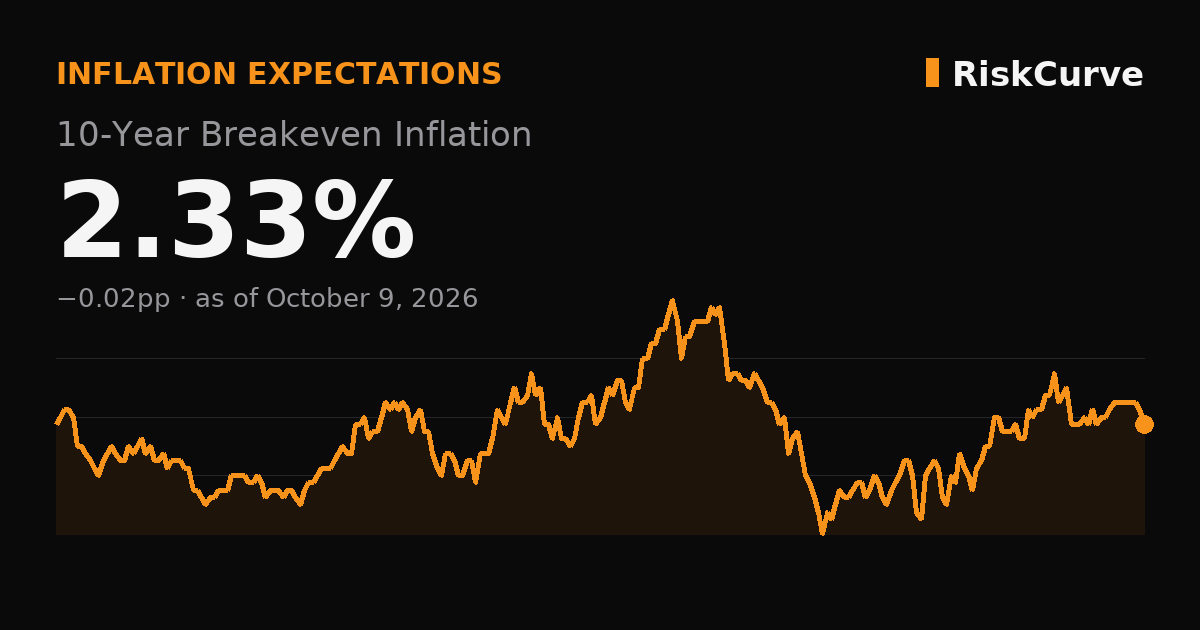
The 10-year breakeven inflation rate is the gap between the yield on a 10-year nominal Treasury and the yield on a 10-year Treasury Inflation-Protected Security (TIPS). It is 2.33% as of October 9, 2026, −0.02pp versus the previous session. A TIPS yield is a return after inflation; a nominal yield is not. The difference is what the bond market prices for average annual inflation over the next ten years — the rate at which the two bonds break even.
It is not a forecast of the CPI. A breakeven bundles the inflation investors expect with the extra compensation they demand for inflation risk, the inflation risk premium. When that premium widens the breakeven rises even if expectations have not moved. TIPS liquidity matters too: in late 2008 forced selling pushed the 10-year breakeven close to zero, and shorter breakevens below it, far beneath what investors actually expected.
A hot CPI print lifts the front end far more than the ten-year, because a single month’s surprise fades. The ten-year responds to what changes where inflation settles — energy shocks, fiscal news, the Fed’s credibility, and TIPS supply and demand. That is why the 5-year, 5-year forward matters: it strips out near-term noise and asks whether the market expects inflation to settle around the Fed’s goal.
For investors the breakeven divides nominal from real. When it rises, a nominal bond loses purchasing power faster than its coupon implies and inflation-protected securities and real assets are the hedge; when it falls, the reverse. Read it against the Fed’s target with one adjustment: TIPS pay out on CPI, which usually runs a few tenths above the PCE measure the Fed targets, so a breakeven in the low-to-mid 2s is broadly consistent with the 2% goal. A sustained move well above that is the warning sign.
It is 0.04pp lower than a month ago (Sep 09, 2026), and 0.01pp lower than a year ago (Oct 09, 2025).
It is above the 2.32% average of the period we track, which has run from 2.18% (Jun 24, 2026) to 2.50% (May 04, 2026) — the highest since Oct 08, 2026.
10-Year Breakeven Inflation — recent values
| Date | Value |
|---|---|
| Oct 09, 2026 | 2.33% |
| Oct 08, 2026 | 2.35% |
| Oct 07, 2026 | 2.36% |
| Oct 06, 2026 | 2.36% |
| Oct 05, 2026 | 2.36% |
| Oct 02, 2026 | 2.36% |
| Oct 01, 2026 | 2.36% |
| Sep 30, 2026 | 2.36% |
| Sep 29, 2026 | 2.35% |
| Sep 28, 2026 | 2.34% |
Values as published by the source. Macro series are revised after first release; this table shows the most recent vintage. Saved dataset: JSON.
Common questions
- Is the breakeven inflation rate a CPI forecast?
- No. It is the rate at which a nominal Treasury and an inflation-protected Treasury of the same maturity would deliver the same return, as priced by the market. It contains an inflation risk premium and can be distorted by TIPS market liquidity and taxes, so it is a price with a premium inside it rather than a forecast of the CPI.
- Why do people watch the 5-year, 5-year forward instead?
- The 5y5y forward covers the five years that begin five years from now, so it excludes the near-term price shocks that dominate a plain 10-year breakeven. If the 10-year breakeven jumps on an oil move but the forward does not, the market has changed its view of the next few years, not of the long run. It is the cleanest market read on whether inflation settles around the Fed’s target.
- Why isn’t the breakeven exactly 2% if the Fed targets 2%?
- Two reasons, and they differ in size. The Fed’s 2% goal is for PCE inflation, while TIPS are indexed to CPI, which has historically run a few tenths of a percentage point higher; a breakeven in the low-to-mid 2s is therefore roughly on target rather than above it. On top of that, two premiums pull in opposite directions: an inflation risk premium that can lift it, and a TIPS liquidity premium that lowers it. The practical consequence: compare breakeven levels with each other over time rather than against 2% directly.
- Does a higher breakeven mean higher interest rates?
- Not by itself. A breakeven can rise because expected inflation rose, which usually lifts nominal yields, or because investors demanded more compensation for inflation risk, which widens the gap between nominal and real yields without necessarily changing the real cost of capital. Real yields, not breakevens, are the hurdle rate for investments.
- Why is the breakeven different from survey expectations?
- Surveys ask what people expect; the breakeven is what someone will pay to be protected. The two often diverge, because a market price can move in a day while surveys move slowly. The Federal Reserve Bank of Cleveland publishes model-based estimates that use Treasury yields, inflation data, inflation swaps and surveys to separate expected inflation from the risk premium, and those sit between the two.
- How is the 10-year breakeven calculated?
- It is the 10-year nominal Treasury constant-maturity yield minus the 10-year TIPS constant-maturity yield, both from the Treasury’s daily yield curve data. The figure on this page is the series the Federal Reserve Bank of St. Louis publishes from that data, credited as Treasury via FRED.