The 30-second version
Interest rates on U.S. government bonds jumped this week. It wasn't because people expect more inflation. It was the "real" part of the rate, what you earn after inflation, that went up. That makes money tighter for everyone, and the riskiest investments tend to feel it first.
First, a quick decoder
Every bond yield is made of two pieces:
Real yield: what you earn on top of inflation. Think of it as the true price of money.
Breakeven: the inflation rate the market expects. It's the gap between a regular Treasury bond and an inflation-protected one (called TIPS).
Add the two together and you get the yield you hear quoted on the news. So when that number moves, the question to ask is: which piece moved?
What moved
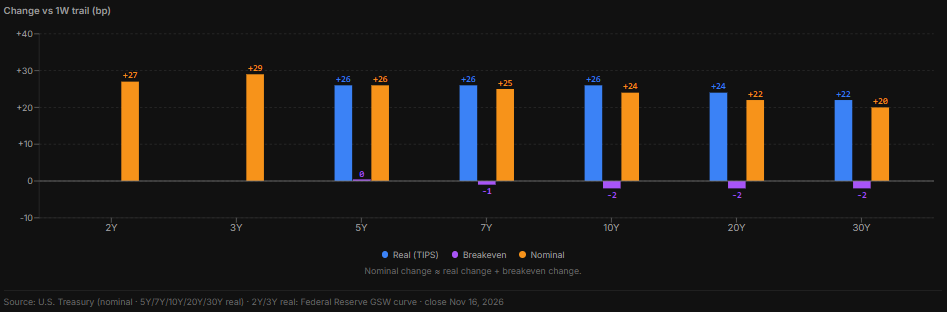
This week, it was almost all the real piece.
The 10-year real yield rose 0.26 percentage points in a week, to 2.92%. Traders call that 26 "basis points"; a basis point is one-hundredth of a percent.
It rose by about the same amount on every bond, from 5 years out to 30 years.
Inflation expectations barely moved. The 10-year breakeven slipped just 0.02 points, to 2.20%.

And it's not just one week. RiskCurve's Real Rates Regime model sorts the market into a few simple states based on which piece is moving. It flipped to Tightening on Nov 12, and it's a strong reading. Over the last 20 trading days, the real yield is up 0.18 points while inflation expectations are down 0.15.
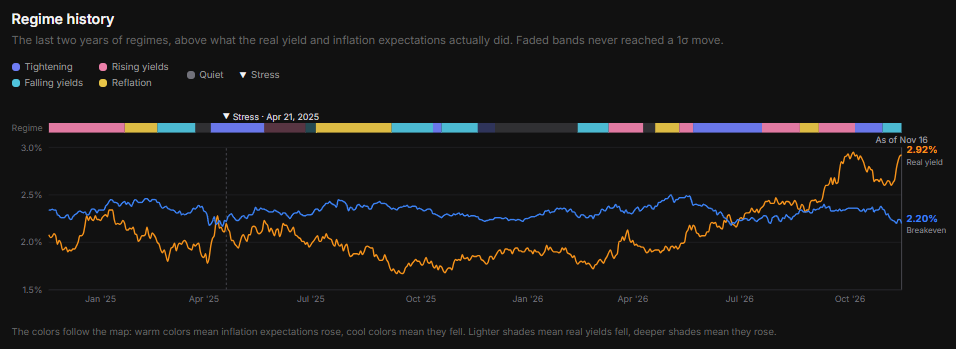
Zoom out and you can see how big this is. You don't need to read every color; just follow the orange line, the real yield. A year ago it was 1.06 points lower (10-year real yield). Now it sits well above inflation expectations, the blue line.
Why it matters
When the real part of rates goes up while inflation expectations go down, money gets tighter. Borrowing costs more after inflation, and a safe government bond pays you more after inflation too.
That's tough on stocks and on everything far out on the "risk curve," the riskiest end of investing. They now have to compete with a safe return that already beats inflation.
Meanwhile, growth is still strong. The Fed's own statement says the economy is "expanding at a strong pace."
How we got here (my take)
Oil. The war in Iran sent oil prices soaring. North Sea crude hit $136 a barrel on Oct 8. It's back to about $93, but that's still $22 more than before the war (IEA). Prices have come down, but those energy costs already spread into the prices of other things. Economists call that core inflation.
The Fed hesitated. The Fed raised rates in September, then hit pause on Oct 28, even though its own statement said "inflation remains elevated." Two of its voters disagreed and wanted another hike. To me, that's the Fed being timid.
Government spending is part of it too.
And because the Fed isn't saying much about what it'll do next, the market keeps swinging back and forth.
What I'm watching
Bond prices imply a 100% chance the Fed raises rates at its Dec 9 meeting (see the odds). Before then, a few reports will show how the economy and the job market are holding up:
Weekly jobless claims (Nov 19, Nov 27, Dec 3): how many people filed for unemployment.
S&P Global flash PMI (Nov 23): an early survey of how businesses are doing.
ISM manufacturing and services surveys (Dec 1 and Dec 3): bigger surveys of factories and service companies.
The jobs report (Dec 4): how many jobs were added, and the unemployment rate.
These numbers will shape how many more hikes the market prices in for 2027. Right now it's about four, which puts the Fed's rate at a market-implied 4.86% after the December 2027 meeting, up from 3.88% today.
Data: U.S. Treasury; Federal Reserve H.15 via FRED. Live charts: Yields, 10-Year Real Yield, Fed Rate Expectations, Real Rates Regime (regimes and σ moves: RiskCurve calculation). Oil: IEA Oil Market Report, November 2026. Fed: FOMC statement, Oct 28, 2026; CNBC, Oct 28, 2026. Education, not investment advice.